How to create interactive table from geodata in R using DataTables
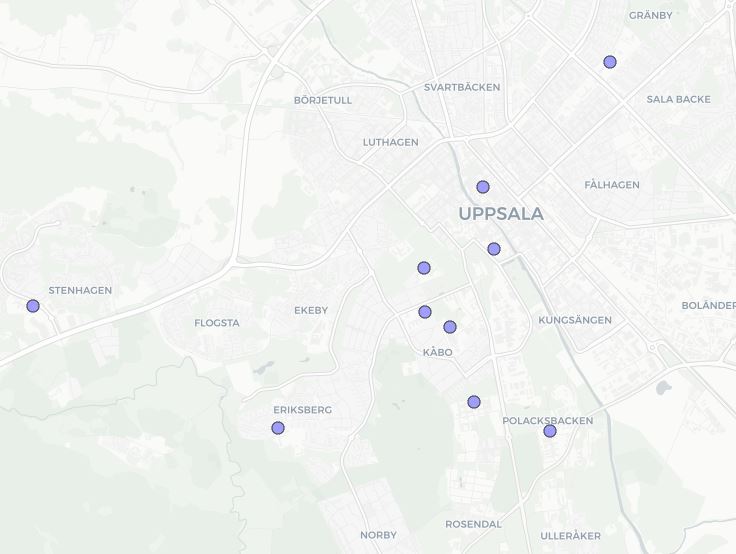
I was looking for a way to create an interactive table from geodata, in this case data from OpenStreetMap. Perhaps a table with the libraries in Uppsala, Sweden? Extracting geodata from OSM...