
Planning to dine out today? Here are 20 000+ restaurants in India to choose from. OpenStreetMap contains vast amounts of geodata and this script shows how to download data for an entire nation, extract the desired parts (restaurants, in this case), process it and render a plot.
# Load libraries
library(dplyr)
library(ggplot2)
library(mapview)
library(osmextract)
library(sf)
# Set working directory
setwd("C:\\Eget\\R\\")
# Download data from OpenStreetMap for India and extract restaurants
restaurants_india = oe_get("India",
quiet = FALSE,
layer = "points",
extra_tags = c("amenity", "name", "addr:street", "addr:housenumber", "addr:city", "website"),
query = "SELECT * FROM points WHERE amenity = 'restaurant'")
# Clean attributes
restaurants_india = select(restaurants_india, name, addr_street, addr_housenumber, addr_city, website)
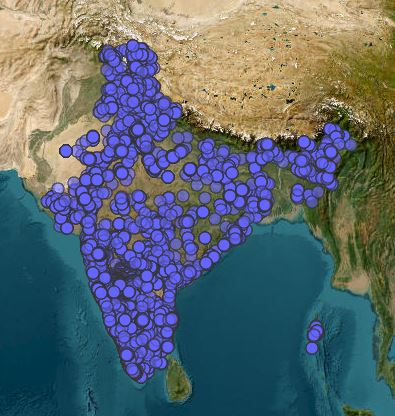
# View result on map
mapview(restaurants_india)
# Download file with administrative divisions from https://geodata.lib.utexas.edu/catalog/stanford-mw277wc3858
url = "https://stacks.stanford.edu/file/druid:mw277wc3858/data.zip"
destfile = "India_admin_divisions.zip" # Use the working directory in this case
download.file(url, destfile)
unzip("India_admin_divisions.zip") # Unzip downloaded file
# Count number of restaurants per administrative division
# First, read the shp file administrative divisions
admin_divs = st_read("IND_adm1.shp") # Read unzipped file
admin_divs = select(admin_divs, ID_1, NAME_1) # Clean attributes
# Spatial join to count points for each polygon
inter <- st_intersects(admin_divs, restaurants_india)
admin_divs$count <- lengths(inter)
# Create plot
ggplot(admin_divs) +
geom_sf(aes(fill = count)) +
scale_fill_gradient(low = "white", high = "blue", labels = scales::comma) +
labs(title = "Number of restaurants 2023-09-07") +
theme(plot.title = element_text(hjust = 0.5)) +
scale_x_continuous(labels = function(x) paste0(x, "\u00b0")) +
scale_y_continuous(labels = function(y) paste0(y, "\u00b0"))Use mapview(restaurants_india) to check the locations:
This is a flexible and easy method for processing OpenStreetMap data and combining it with other data sources. But what if the data in OpenStreetMap is incomplete? You can help improve the data, have a look at Contributing to OpenStreetMap.