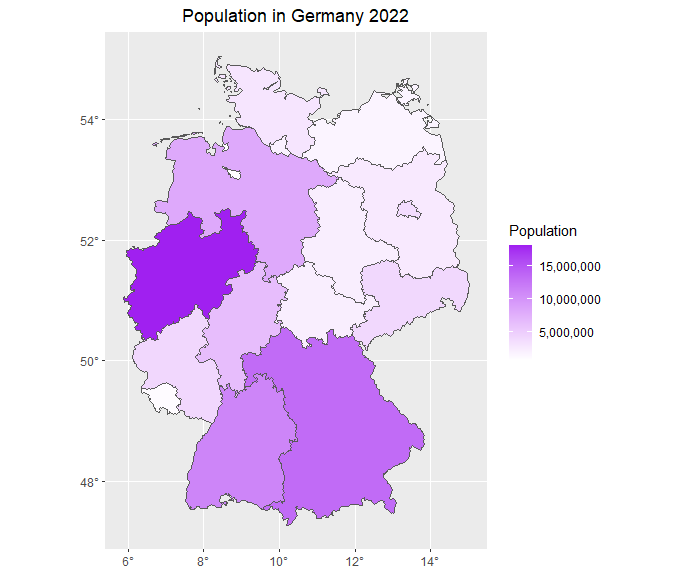
This wouldn´t be a GIS site without an example of how to make a choropleth map using ggplot in R. Based on Making a choropleth web map with R/Leaflet.
# Load libraries
library(dplyr)
library(ggplot2)
library(giscoR)
library(readxl)
library(sf)
library(stringr)


# Set working directory
setwd("C:\\Eget\\R\\")

# Get administrative boundaries for regions in Germany, NUTS level 1
germany <- gisco_get_nuts(country = "Germany",
                          nuts_level = 1,
                          resolution = "3")

germany$NUTS_NAME = str_to_title(germany$NUTS_NAME, locale = "en")   # Convert name to title case

# Read Excel file with population data
# Data from https://www.destatis.de/EN/Themes/Society-Environment/Population/Current-Population/Tables/population-by-laender.html
population <- read_excel("Indata\\Germany population.xlsx",sheet = "Population")

# Join GeoPackage and Excel file
germany = left_join(germany, population, by = join_by("NUTS_NAME" == Name))

# Create plot
ggplot(germany) +
  geom_sf(aes(fill = Population)) +
  scale_fill_gradient(low = "white", high = "purple", labels = scales::comma) +
  labs(title = "Population in Germany 2022") +
  theme(plot.title = element_text(hjust = 0.5)) +
  scale_x_continuous(labels = function(x) paste0(x, "\u00b0")) +
  scale_y_continuous(labels = function(y) paste0(y, "\u00b0"))
You can of course read your geometries using the sf function st_read instead, if you want to use a specific set of geometries.
Your code is very readable. Thanks for this
Thanks! I try to comment the code, make it readable and easy to use.