We´ve covered several web maps made with Leaflet in R. Here, I´ll show a few of the Leaflet plugins available in the library leaflet.extras2. These add features and interactivity to the web map, improving the user experience.
Side by side
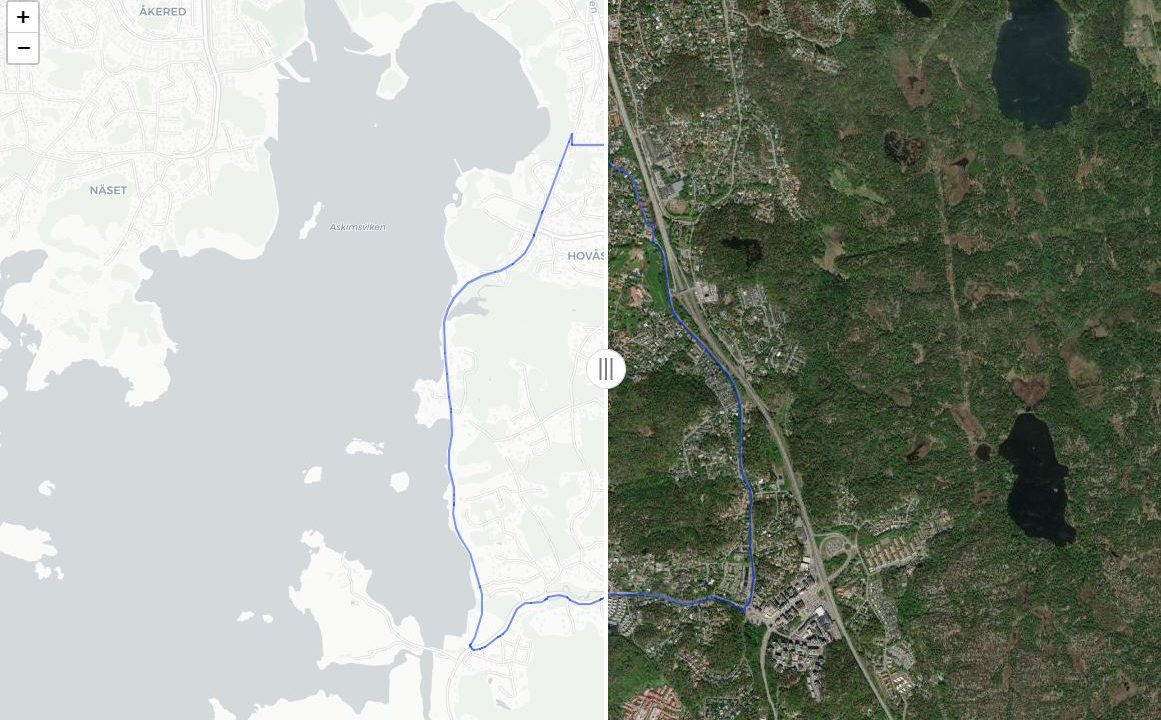
What if you want to compare two data sets easily? In this case, you can use them side by side:
Here, you could provide background maps, such as orthophotos from two different years, making it easier for the user to compare the result.
Code:
# Load libraries
library(htmlwidgets)
library(leaflet)
library(leaflet.extras2)
library(sf)

# Set working directory
setwd("C:\\Eget\\R\\")

# Read GeoPackage with bike route
bike_route = st_read("Indata\\Bike_route.gpkg")
bike_route = st_transform(bike_route, 4326)   # Reproject from EPSG 3006 to 4326


split_map = leaflet() %>%
  addMapPane("left", zIndex = 0) %>%
  addMapPane("right", zIndex = 0) %>%
  addTiles(group = "base", layerId = "baseid",
           options = pathOptions(pane = "right")) %>%
  addProviderTiles(providers$CartoDB.Positron, group="Positron", layerId = "positronid",
                   options = pathOptions(pane = "left")) %>%
  addProviderTiles(providers$Esri.WorldImagery, group="World Imagery", layerId = "imageryid",
                   options = pathOptions(pane = "right")) %>%
  addPolylines(data=bike_route, group = "Bike route", weight = 2)%>%
  addSidebyside(layerId = "sidecontrols",
                rightId = "baseid",
                leftId = "positronid")

split_map

# Save map to disk
saveWidget(widget = split_map, file = "Split_map.html")
TimeSlider
Some geodata has a time dimension. In this example, a time slider enables the user to go forward to a specific point in time for viewing earthquakes.
Code:
# Load libraries
library(dplyr)
library(htmlwidgets)
library(leaflet)
library(leaflet.extras2)
library(sf)
library(stringr)

# Set working directory
setwd("C:\\Eget\\R\\")

# Read earthquake csv file from USGS
quakescsv <- read.csv("https://earthquake.usgs.gov/earthquakes/feed/v1.0/summary/1.0_day.csv")

# Earthquake coordinates -> spatial data (EPSG = 4326)
earthquakes_points <- st_as_sf(quakescsv, coords = c("longitude", "latitude"), crs = 4326)

# Manage time attribute
earthquakes_points = select(earthquakes_points, time)   # Keep only time
earthquakes_points$time <- str_replace_all(earthquakes_points$time,'T',' ')   # Replace T with space
earthquakes_points$time = str_sub(earthquakes_points$time, end = -6)   # Remove unwanted characters for time


# Create Leaflet map
time_slider_map = leaflet() %>%
  setView(lng = -50, lat = 10, zoom = 1) %>%   # Set map center
  addTiles() %>%
  addTimeslider(data = earthquakes_points,
                options = timesliderOptions(
                  position = "topright",
                  timeAttribute = "time",
                  range = TRUE))

time_slider_map

# Save map to disk
saveWidget(widget = time_slider_map, file = "Time_slider_map.html")
Antpath
What if you want to visualize your latest bike ride with an animation? How to animate a line with Leaflet Ant Path:
Code:
# Load libraries
library(htmlwidgets)
library(leaflet)
library(leaflet.extras2)
library(sf)

# Set working directory
setwd("C:\\Eget\\R\\")

# Read GeoPackage with bike route
bike_route = st_read("Indata\\Bike_route.gpkg")
bike_route = st_transform(bike_route, 4326)   # Reproject from EPSG 3006 to 4326

bike_route_map = leaflet() %>%
  addAntpath(data = bike_route, color = "RED", weight = 4, options = antpathOptions(delay = 3000))  %>%
  addProviderTiles(providers$Esri.WorldImagery)

bike_route_map

# Save map to disk
saveWidget(widget = bike_route_map, file = "Bike_route_map.html")
The line digitalization direction determines the outcome, so make sure to ride your bike in the right direction or correct/reverse the line segments, otherwise the result will be less than impressive. There are tools for reversing line segments in most GIS packages, if you need to edit this manually.
Road network from NVDB.
There, three examples of Leaflet web map plugins in R.