I was looking for a way to create an interactive table from geodata, in this case data from OpenStreetMap. Perhaps a table with the libraries in Uppsala, Sweden? Extracting geodata from OSM is straightforward in R, see Downloading data from OpenStreetMap with R and Calculating geodata statistics using OpenStreetMap and R for two methods. This time, we´ll use a third method for accessing the data: SHP-files for Sweden, downloaded from GeoFabrik. This script will:
- Read SHP-files: points of interest and municipalities
- Clean the data: Filter, reproject POIs to SWEREF 99 TM, remove rows with NULL data, remove unwanted attributes
- Find the libraries in Uppsala
- Drop the geometry, not needed in the table
- Order the libraries by name
- Create the table using the DT package
- And finally, save the table to an HTML file
# Load libraries
library(dplyr)
library(DT)
library(sf)
# Set working directory
setwd("C:\\Eget\\R\\")
# Read geodata
points = st_read("Indata\\gis_osm_pois_free_1.shp", options = "ENCODING=UTF-8") # shp file with points of interest
municipalities = st_read("Indata\\ak_riks.shp", options = "ENCODING=UTF-8") # shp file with municipalities
# Filter and reproject libraries
libraries <- points |>
filter(fclass == "library")
libraries = st_transform(libraries, 3006) # Reproject libraries from WGS 84 to SWEREF 99 TM
# Filter municipalities
uppsala <- municipalities |>
filter(KOMMUNNAMN == "Uppsala")
# Find libraries in Uppsala
libraries_uppsala = st_intersection(libraries, uppsala)
libraries_uppsala = select(libraries_uppsala, osm_id, name) # Remove a few attributes
libraries_uppsala= libraries_uppsala %>% # Remove NULL data rows
na.omit()
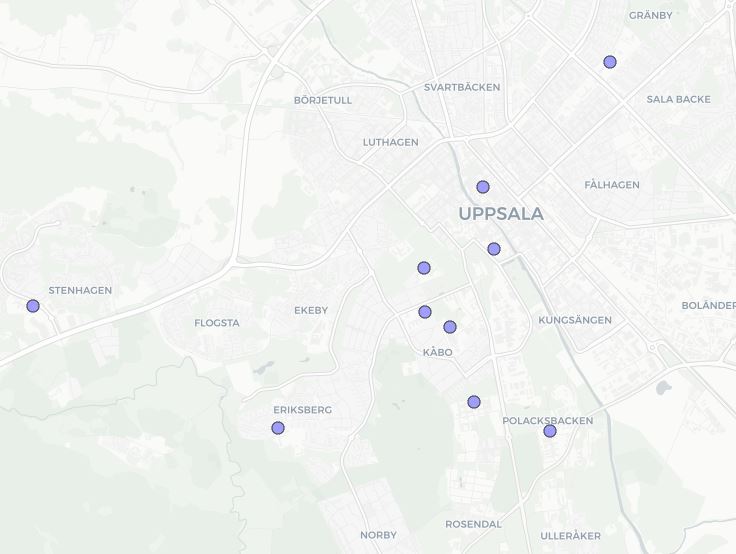
mapview(libraries_uppsala) # Inspect result on map
libraries_uppsala = st_drop_geometry(libraries_uppsala) # Drop geometry, not needed in table
libraries_uppsala = libraries_uppsala[order(libraries_uppsala$name),] # Sort data by library name
# Create table
libraries_table = datatable(libraries_uppsala, class = 'stripe cell-border', rownames = FALSE)
libraries_table # View table
# Save table to disk
saveWidget(widget = libraries_table, file = "Libraries_Uppsala_table.html")The resulting table:
The DT package, an interface to DataTables, is a versatile package with lots of options for creating formatted tables. Have a look at https://rstudio.github.io/DT/ for a more detailed description. Combined with a map, this will be very useful.
Of course, using “mapview(libraries_uppsala)” in the script is not really necessary. I tend to use mapview() for inspecting the data, to make sure that it´s ready for the next steps.
Speaking of the files from GeoFabrik, it might be useful to know that they are updated daily, so in case you make edits to OpenStreetMap, you don´t have to wait for long to access the updated files.