
How about a continuously updated, near real-time global data set for fires? At https://firms.modaps.eosdis.nasa.gov/map/, the system is described as “The Fire Information for Resource Management System (FIRMS) distributes Near Real-Time (NRT) active fire data from the Moderate Resolution Imaging Spectroradiometer (MODIS) aboard the Aqua and Terra satellites, and the Visible Infrared Imaging Radiometer Suite (VIIRS) aboard S-NPP and NOAA 20 (formally known as JPSS-1). Globally these data are available within 3 hours of satellite observation, but for the US and Canada active fire detections are available in real-time.” There is a web map and the data is available for download in various formats. There is even a guide for using it in QGIS and in this post, we will add a few steps to the process. We´ll dive right in:
- Start a new, empty project and set the coordinate reference system to EPSG:3857. This is what the fire data and most background maps use. You will find the button in the bottom right corner.
- You probably want a background map or two, let´s use a few from the plugin QuickMapServices. If you don´t have it already, install the plugin in the menu Plugins – Manage and Install Plugins…
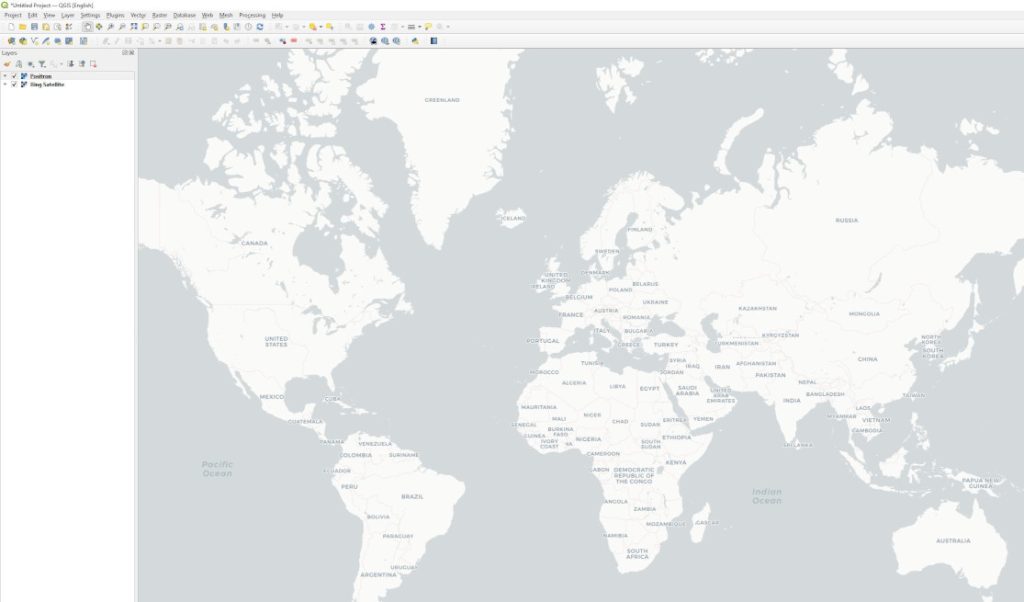
- Installing the plugin adds the menu Web – QuickMapServices and go to plugin Settings – More services and click “Get contributed pack”. This will add several base maps services. Let´s add CartoDB-Positron and Bing Satellite. Now, your project should look like this:
Time to add the fire data:
- First, get a free MAP_KEY, it´s required for accessing the WMS.
- Use the NASA tutorial is at https://firms.modaps.eosdis.nasa.gov/tutorials/qgis for adding the WMS. My URL looks like this: https://firms.modaps.eosdis.nasa.gov/mapserver/wms/fires/<insert your map key here>/
- There are a lot of layers to choose from. I picked “fires_modis_24” and “fires_modis_7”. These contain fires for the past 24h and 7 days, respectively. Unfortunately, there is no layer for tomorrow´s fires. Wouldn´t that be a useful layer?
Now, you have a few base maps and the fires layers. Time to examine the data. A few observations I made:
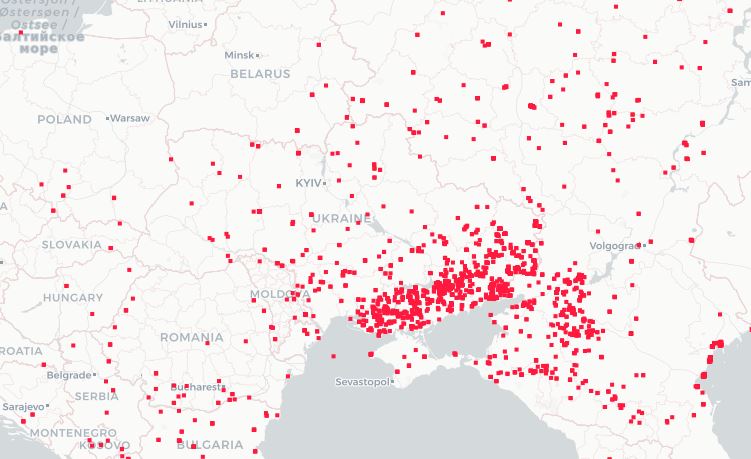
There are a lot of fires in the southern and eastern parts of Ukraine, which is where most of the fighting of the invasion is taking place currently.
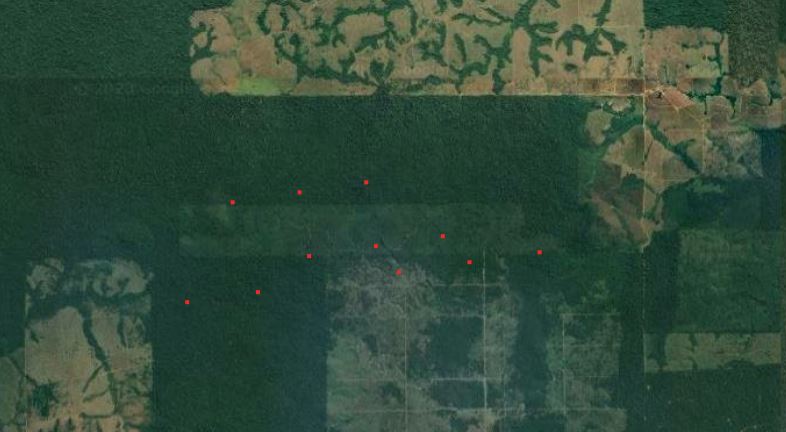
Even more fires are registered in southern Africa and the Amazon rainforest, South America. Clearing forest, making room for more farm land? The fires often seem located near previosly cleared areas.
What are your impressions when looking at this data set?