A small collection of additional R code snippets for web maps with R/Leaflet, after the previous article Creating an interactive web map using R/Leaflet. This time, it´s all about basemaps and WMS layers. Useful data sets for future web maps.
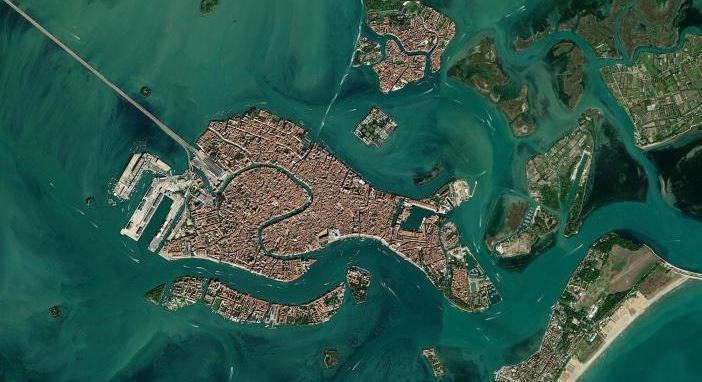
# ESRI World Imagery as background, https://www.arcgis.com/home/item.html?id=10df2279f9684e4a9f6a7f08febac2a9
# Set view to Venice, Italy
leaflet() %>%
  addProviderTiles(providers$Esri.WorldImagery) %>%
  setView(lng = 12.33089, lat = 45.43697, zoom = 13)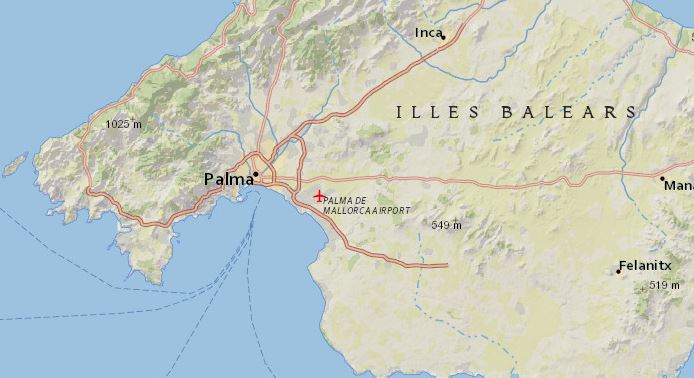
# ESRI National Geographic Basemap, https://www.esri.com/news/arcuser/0312/national-geographic-basemap.html
# Set view to Majorca, Spain
leaflet() %>%
  addProviderTiles(providers$Esri.NatGeoWorldMap) %>%
  setView(lng = 3, lat = 39.6, zoom = 10)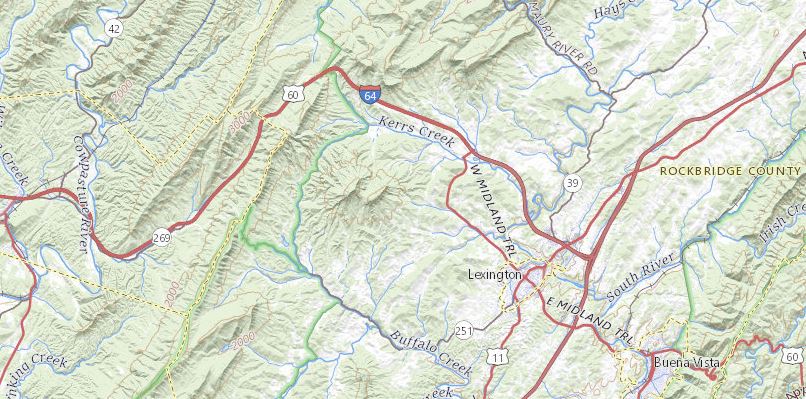
# USGS topographic WMS, https://basemap.nationalmap.gov/arcgis/rest/services/USGSTopo/MapServer
nhd_wms_url <- "https://basemap.nationalmap.gov/arcgis/services/USGSTopo/MapServer/WmsServer"
leaflet() %>%
  setView(lng = -100, lat = 38, zoom = 4) %>%
  addWMSTiles(nhd_wms_url,
              layers = "0",
              attribution = "USGS"
  )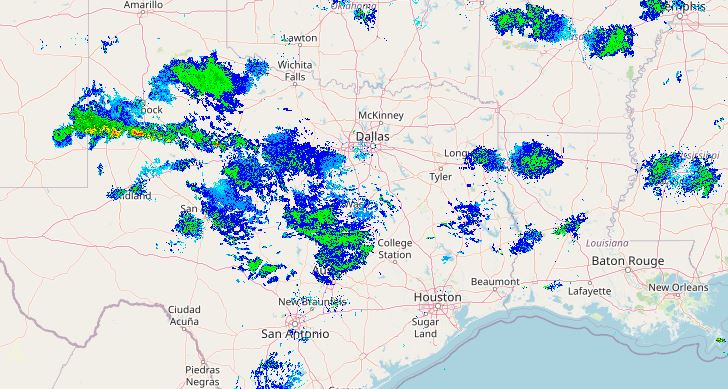
# Weather WMS from Iowa State University
leaflet() %>%
addTiles() %>%
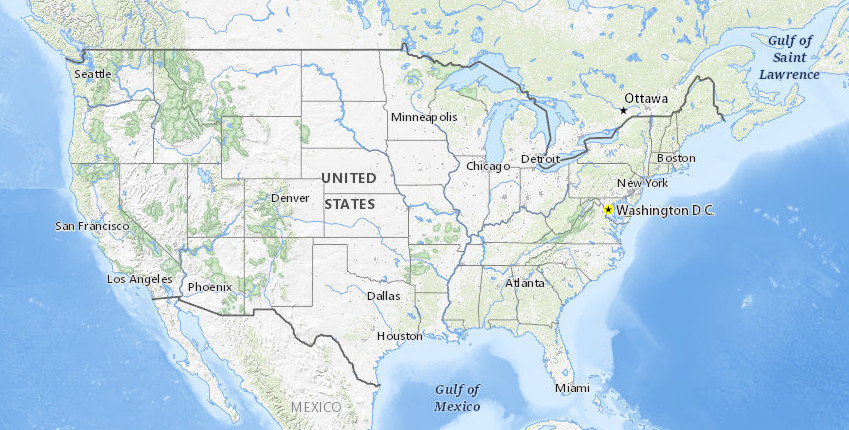
setView(lng = -76.505206, lat = 38.9767231, zoom = 5) %>%
addWMSTiles(
"http://mesonet.agron.iastate.edu/cgi-bin/wms/nexrad/n0r.cgi",
layers = "nexrad-n0r-900913",
options = WMSTileOptions(format = "image/png", transparent = TRUE),
attribution = "Weather data © 2012 IEM Nexrad"
)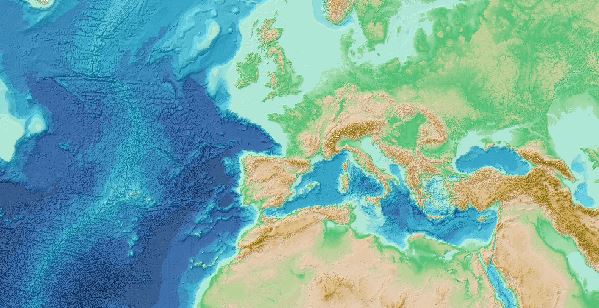
# GEBCO bathymetry WMS, https://www.gebco.net/data_and_products/gebco_web_services/web_map_service/
leaflet() %>%
  addTiles() %>%
  setView(lng = -76.505206, lat = 38.9767231, zoom = 5) %>%
  addWMSTiles(
    "https://www.gebco.net/data_and_products/gebco_web_services/web_map_service/mapserv?",
    layers = "GEBCO_LATEST",
    options = WMSTileOptions(format = "image/png", transparent = TRUE),
    attribution = "GEBCO"
  )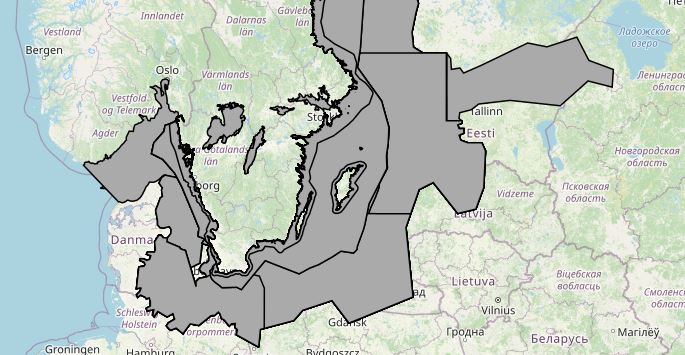
# WMS from HAV, Swedish Agency for Marine and Water Management
leaflet() %>%
  addTiles() %>%
  setView(lng = 16, lat = 60, zoom = 5) %>%
  addWMSTiles(
    "https://geodata.havochvatten.se/geoservices/fiskets-geografier/ows",
    layers = "fiskets-geografier-omraden",
    options = WMSTileOptions(format = "image/png", transparent = TRUE)
  )
Inspired by https://rstudio.github.io/leaflet/basemaps.html and https://sesync-ci.github.io/leaflet-in-R-lesson/index.html.