gishub.io

  • BLOG
  • WEB MAPS
  • ABOUT
  • CONTACT
  • PRIVACY POLICY

gishub.io

This site is aimed at finding and providing solutions to GIS and data processing tasks. It will feature articles about how to find relevant data sets, process (geo)data, visualize and create maps using a mix of tools, such as QGIS, R, PostgreSQL/PostGIS, Python and FME.

Luxury sales

A book about how to succeed in complex sales. For many years, I worked as an GIS/IT consultant, and at the beginning of my career, I struggled to find assignments, not least because I was new to the role, didn’t have a large network, and didn’t really understand sales. Therefore, I have tried to write the book that I should have received on my very first day when I started as a consultant many years ago. When I began to learn how to work smarter and sell effectively, things turned around quickly. In my case, these methods have generated hundreds of thousands of dollars, meaning they have been absolutely crucial for profitability.

To claim that this is a book might be a bit of a stretch, as it’s about 20 A4 pages. Instead of writing a hefty tome, I have succinctly focused on what I’ve learned over the years and what I know has worked exceptionally well for myself and my colleagues. It contains all my best tips for succeeding in sales in a relaxed manner, and I hope it will help you achieve what I call luxury sales, the kind of sales where deals, in some strange way, more or less come to you, time and time again. I can promise you that it’s easier to sell when it’s the customers who are calling you.

Available for $14 here

Previous Next

Visualizing Climate Data With R

  • Magnus Nilsson
  • April 3, 2024
  • climate
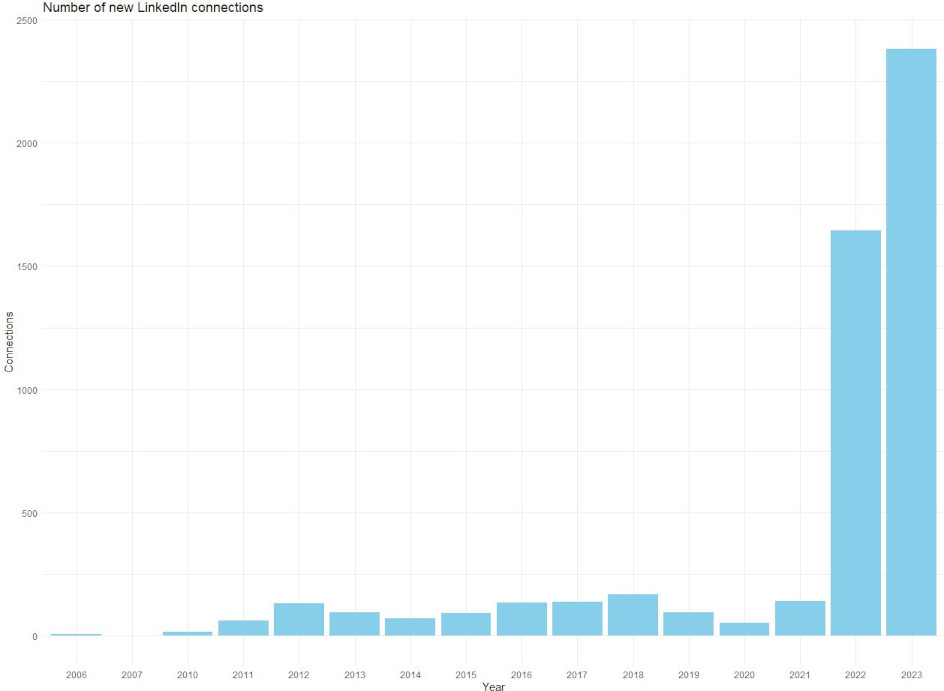
2023 was the warmest year ever recorded and since environmental and climate issues are one of the reasons for starting this site, it’s time to start working. Here, we’ll use R to...
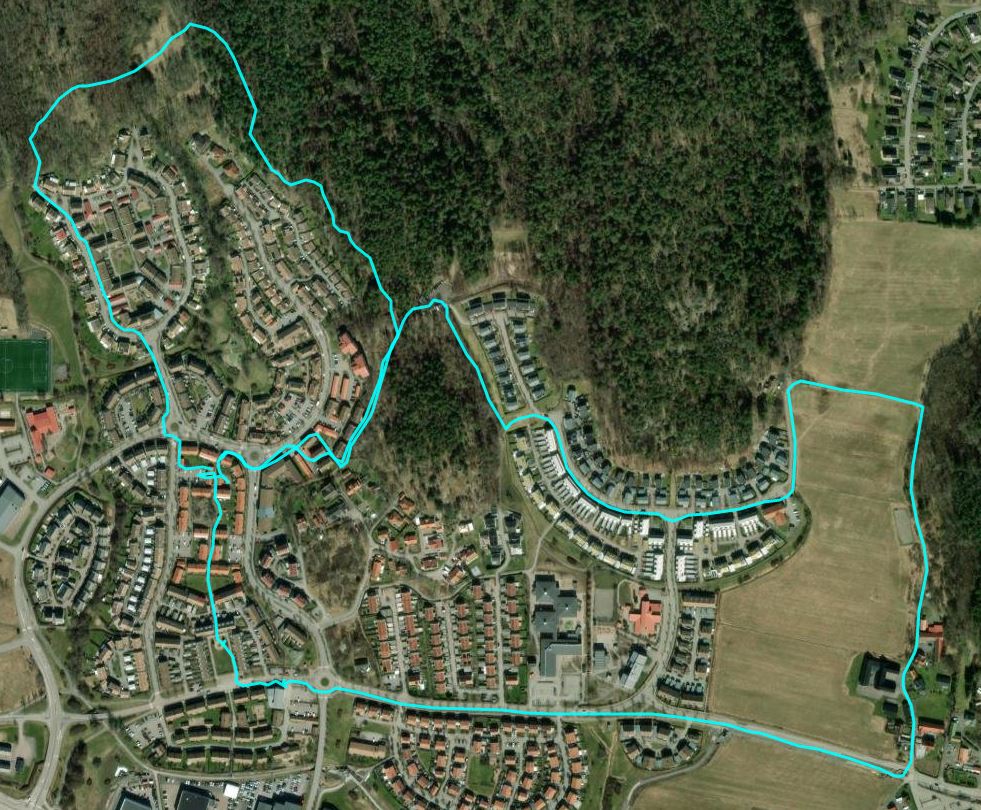
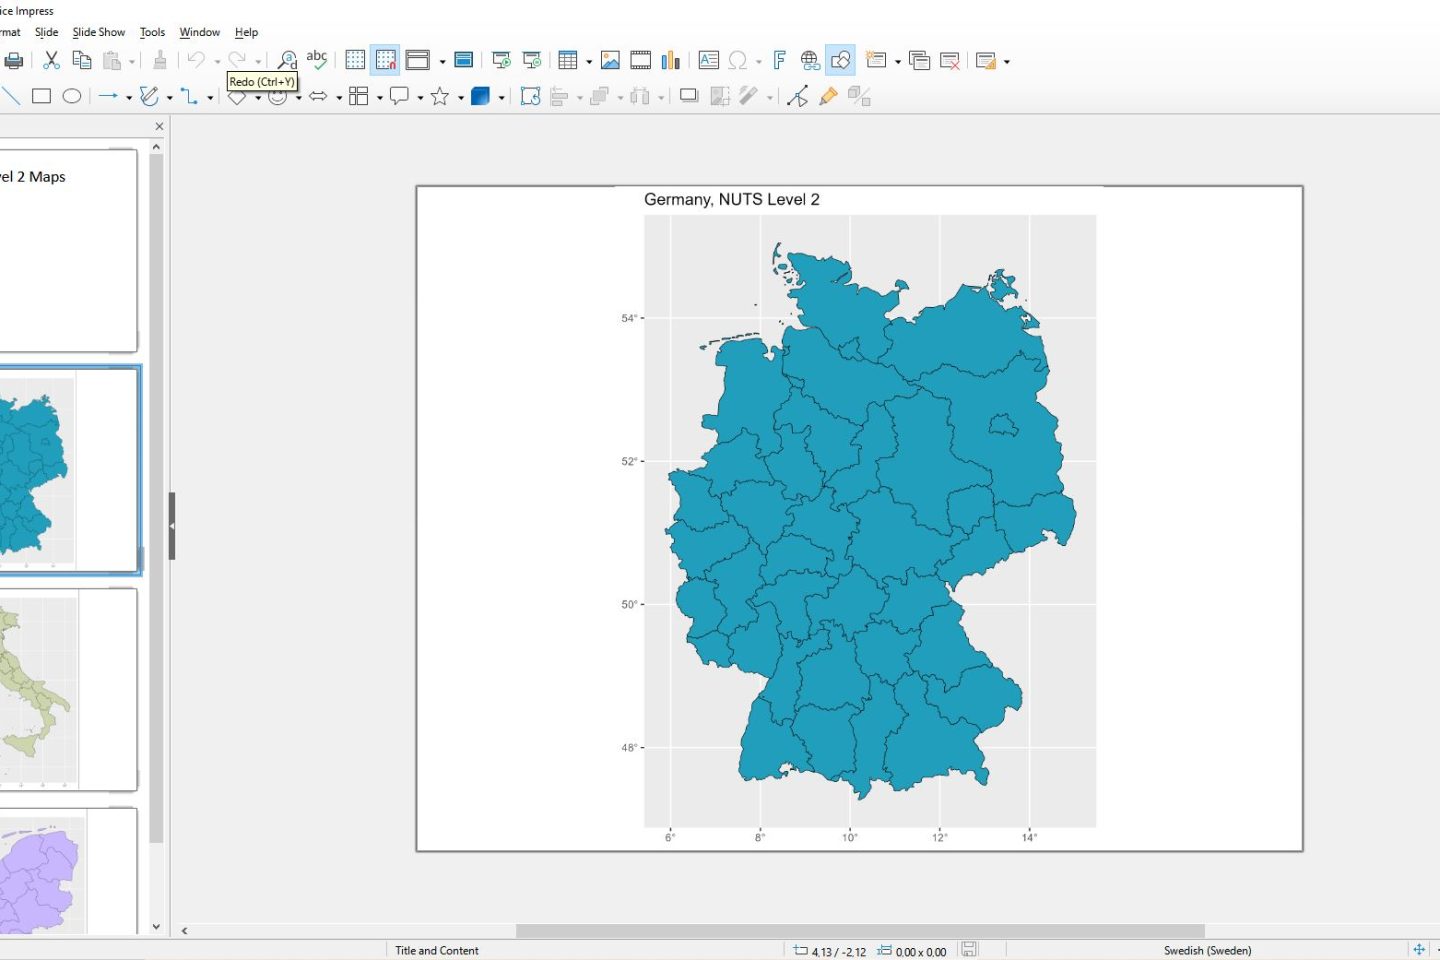
Read More

How to plot statistics from LinkedIn using R

  • Magnus Nilsson
  • October 12, 2023
  • GIS
Shouldn´t there be a LinkedIn feature to plot your connections on a map, at least on a city/state/country level? I didn´t find one, but when I noticed that you can export your...
Read More

How to import Runkeeper GPX data in R

  • Magnus Nilsson
  • October 1, 2023
  • GIS
Do you use Runkeeper or keep a healthy collection of GPX files and want to use R to visualize the data? I realized that I hadn´t worked with GPX data in R,...
Read More

Adding maps to PowerPoint files with R

  • Magnus Nilsson
  • September 27, 2023
  • GIS
Do R and office documents mix? Is it possible to add your maps and plots generated in R to PowerPoint files? Yes, the R package officer can help with these tasks. It...
Read More

Luxury sales – Let the quality of your work sell for you

  • Magnus Nilsson
  • September 26, 2023
  • GIS
A book about how to succeed in complex sales. For many years, I worked as an GIS/IT consultant, and at the beginning of my career, I struggled to find assignments, not least...
Read More

Quality assurance for vector geodata

  • Magnus Nilsson
  • September 26, 2023
  • GIS
Are you tired of recieving geodata with unacceptably high quality? No? Here is my go-to list for ensuring high quality for the vector geodata in my GIS projects. Miscellaneous Attribute fields Attribute...
Read More

Leaflet web map plugins in R

  • Magnus Nilsson
  • September 22, 2023
  • GIS
We´ve covered several web maps made with Leaflet in R. Here, I´ll show a few of the Leaflet plugins available in the library leaflet.extras2. These add features and interactivity to the web...
Read More

Improving the GIS/GIT industry

  • Magnus Nilsson
  • September 19, 2023
  • GIS
Perhaps you already have the fortune of working with GIS/GIT and geodata, and you know what an exciting industry it is, but there is still some work to be done to improve...
Read More

Calculating vector data statistics using a QGIS model

  • Magnus Nilsson
  • September 17, 2023
  • GIS
QGIS processing models, are they any good for calculating basic land use statistics, such as percentage of forest or water? It had to be tried. There are a lot of data sources...
Read More

How to create interactive table from geodata in R using DataTables

  • Magnus Nilsson
  • September 15, 2023
  • GIS
I was looking for a way to create an interactive table from geodata, in this case data from OpenStreetMap. Perhaps a table with the libraries in Uppsala, Sweden? Extracting geodata from OSM...
Read More

Posts pagination

1 2 3 4 5 Next

Recent posts

Visualizing Climate Data With R
April 3, 2024
How to plot statistics from LinkedIn using R
October 12, 2023
How to import Runkeeper GPX data in R
October 1, 2023
Adding maps to PowerPoint files with R
September 27, 2023
Luxury sales – Let the quality of your work sell for you
September 26, 2023

Categories

  • climate
  • GIS

About me

GIS professional with a background in physical geography

Copyright © All Rights Reserved.
  • BLOG
  • WEB MAPS
  • ABOUT
  • CONTACT
  • PRIVACY POLICY